 1932
1932
 2019-03-14

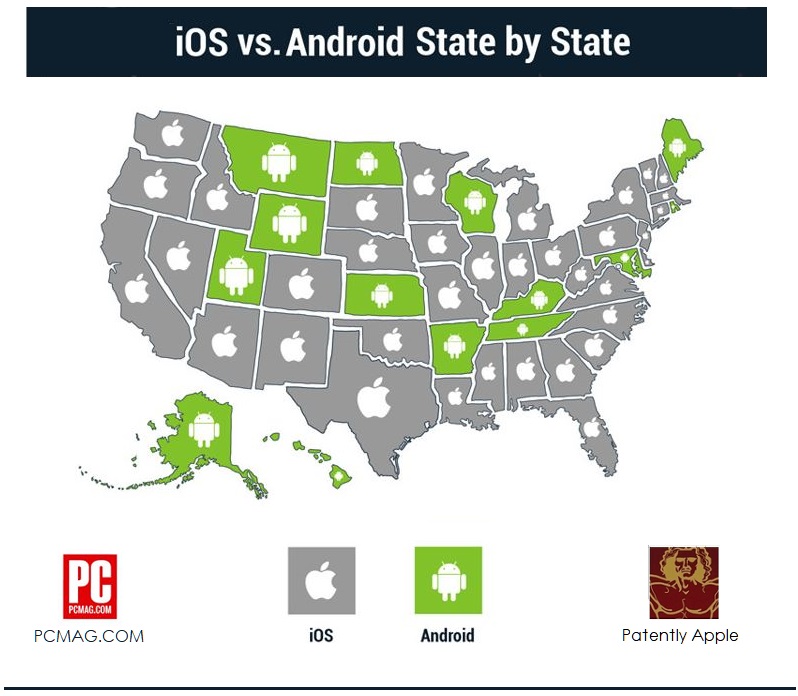
A new Survey published yesterday presented a fascinating chart showing Apple's dominance in the mobile operating battle over Google's Android. Apple's iOS dominated in 36 our of 50 U.S. states and the more populous states at that.

PCMag surveyed 2,033 US consumers in February on a variety of tech topics, gathering additional demographic data including state-by-state. While the most recent comScore rankings show Android at 54.2 percent market share in the US and iOS at 44.8 percent as of December 2018, PCMag's survey found that only 14 states were predominately Android users compared to 36 for iOS.
Overall, 54 percent of respondents chose iOS as their smartphone OS of choice, 42 percent chose Android, 2 percent chose Other, and 2 percent chose None. Good for you, people off the grid.
Another interesting factoid is that the states where Android won out in PCMag's survey were primarily less populous ones, including Alaska, Arkansas, Hawaii, Kansas, Kentucky, Maine, Montana, and Wyoming.
For iOS, the most popular states were Connecticut at 73 percent of respondents, Missouri at 72 percent, and Mississippi at 71 percent. In the states with the highest populations densities, the races were a bit tighter, but iOS still wound up with sizable leads. In California and New York, iOS had 58 percent in both states to Android's 40 percent in CA (2 percent other) and 37 percent in NY (5 percent other.) Illinois was even wider at 63 percent for iOS and 33 percent for Android (4 percent other.)
For more on this, check out the full PCMag's survey/report here.